File input
Building live workflows with Norsk Studio is simple. Just drag and drop components onto the canvas, connect them, and hit play.
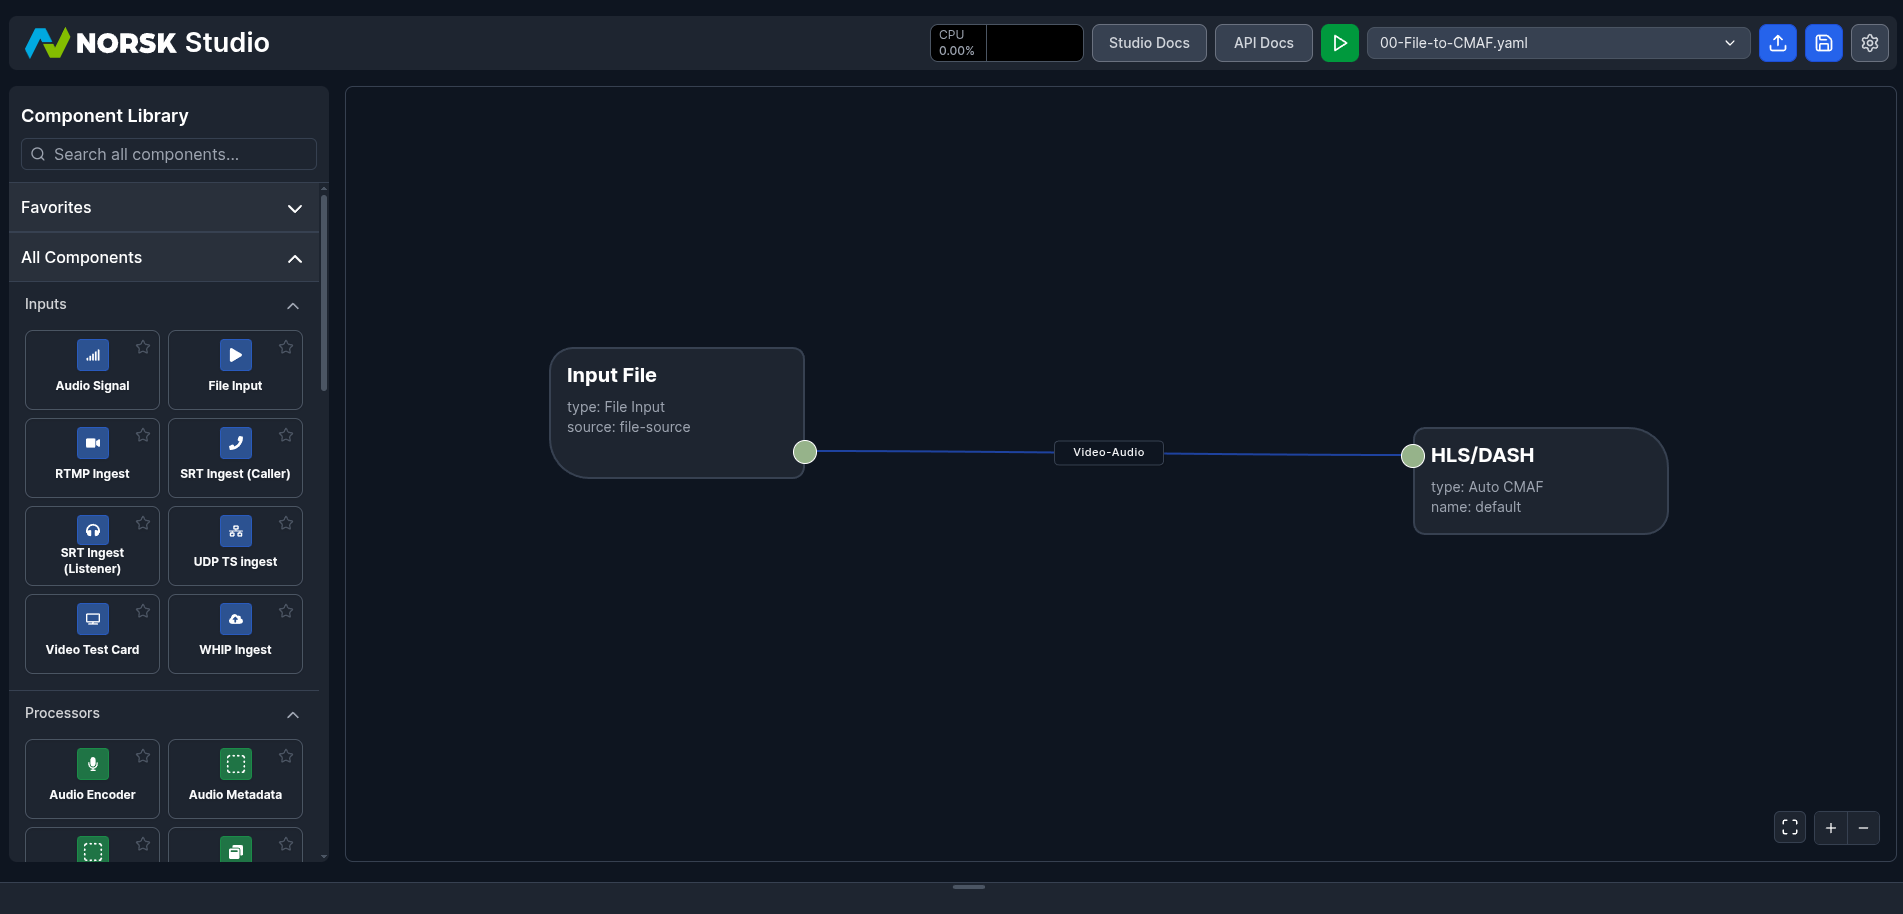
Clicking on the drop-down labelled Blank Workflow should give you several prebuilt workflows. A simple example is 00-File-to-CMAF.yaml. Click on it and you should see a workflow that takes a file input and delivers it as CMAF for playback on HLS/DASH players:
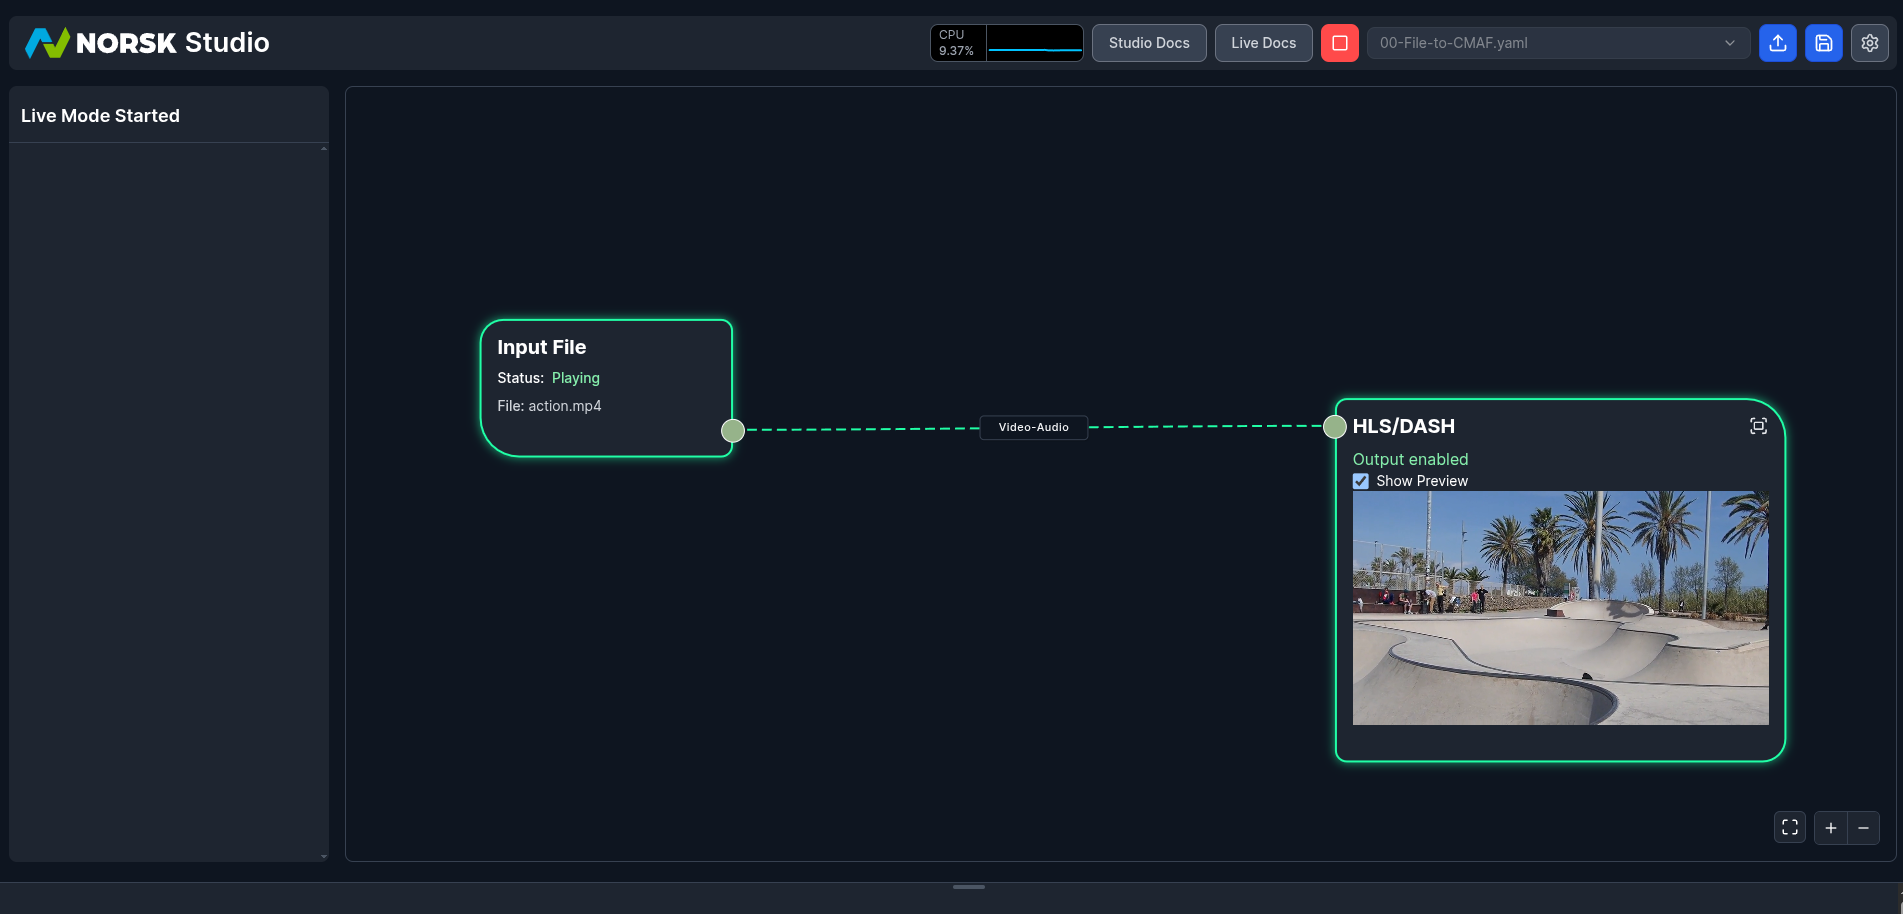
Hit the play button to see the workflow go live and the media file begin to play:
SRT input and ABR
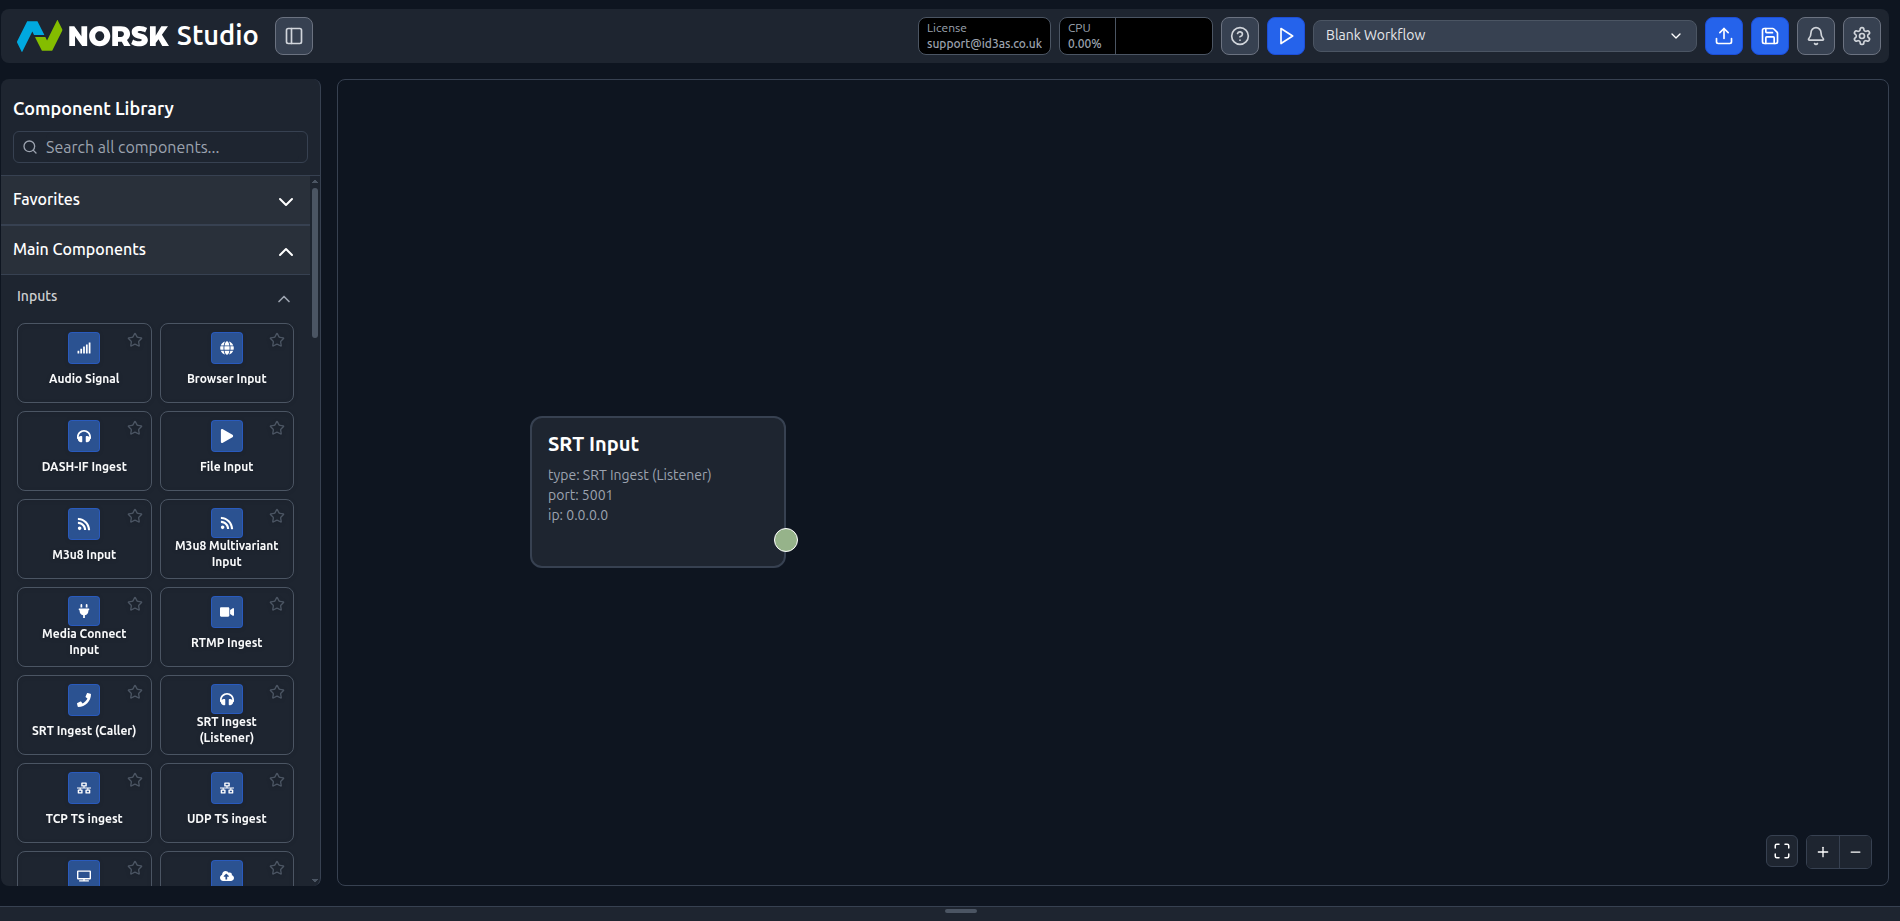
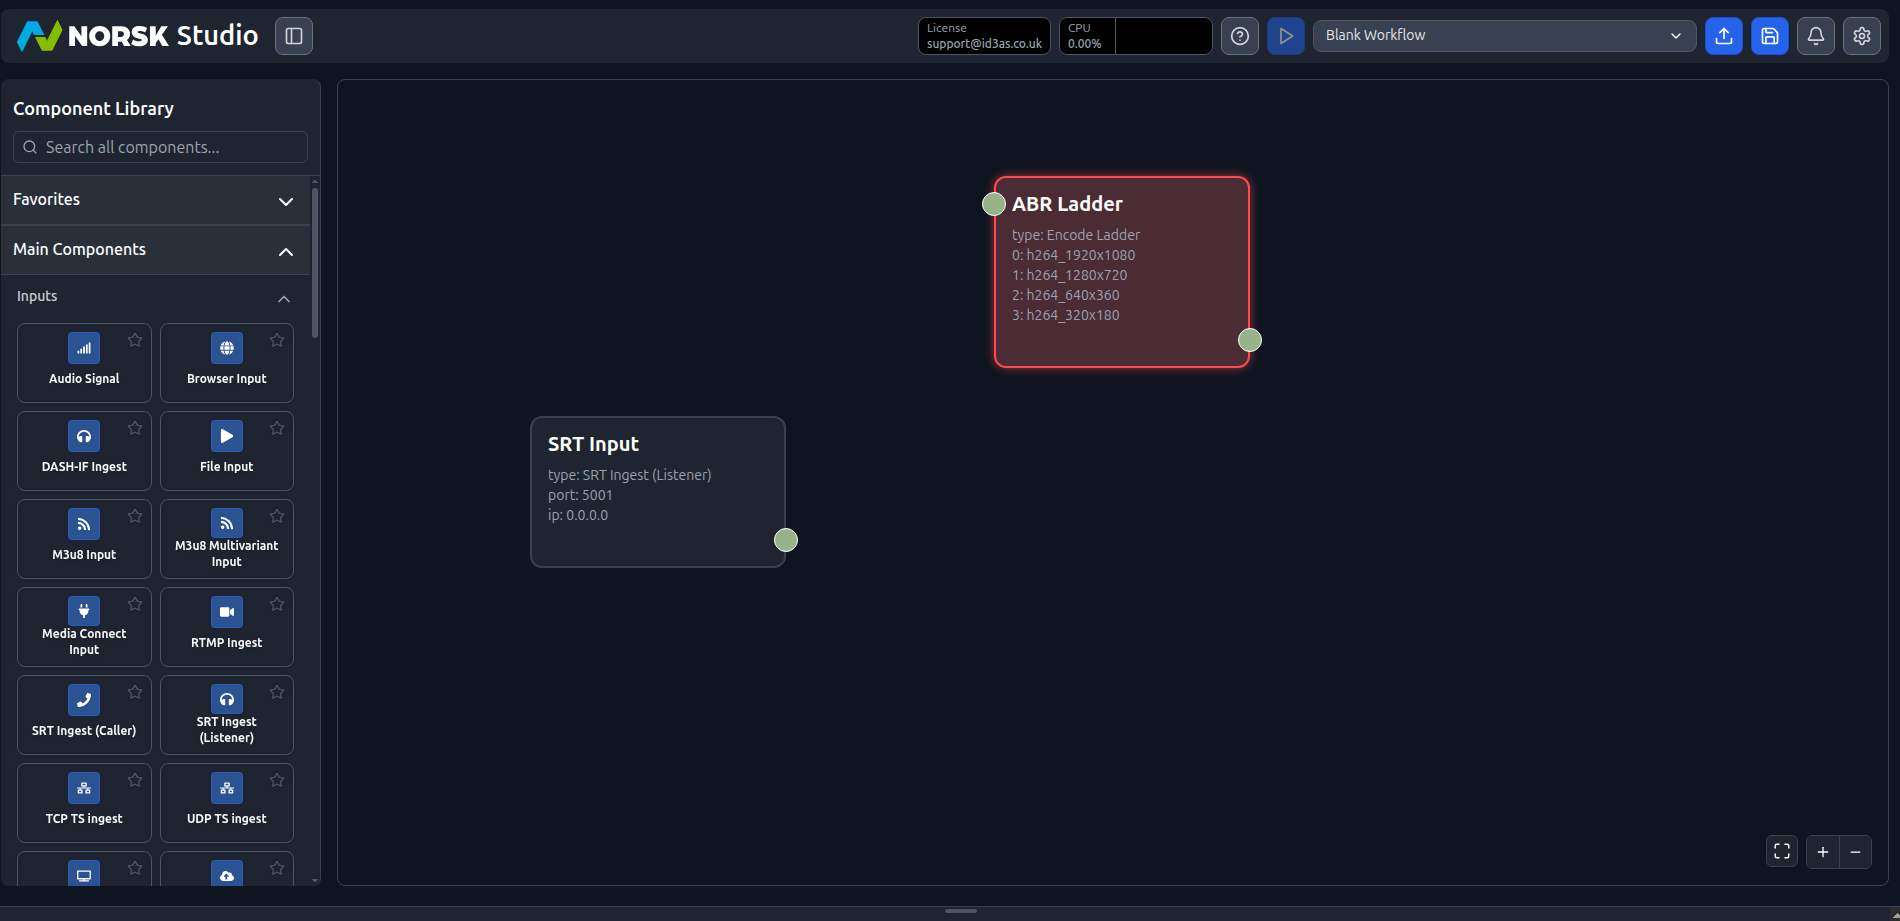
For this second example, we’ll build a workflow from scratch using an SRT source instead of a file input — and add adaptive bitrate (ABR) delivery along the way. Start from a Blank Workflow and drag an SRT Ingest (Listener) component onto the canvas. By default it listens on port 5001 across all interfaces (0.0.0.0):
Since we’re delivering to HLS/DASH, we can make use of ABR. Drag an Encode Ladder component onto the canvas. The default ladder produces four H.264 renditions — 1080p, 720p, 360p, and 180p — so the player can adapt to whatever the viewer’s network and device can handle:
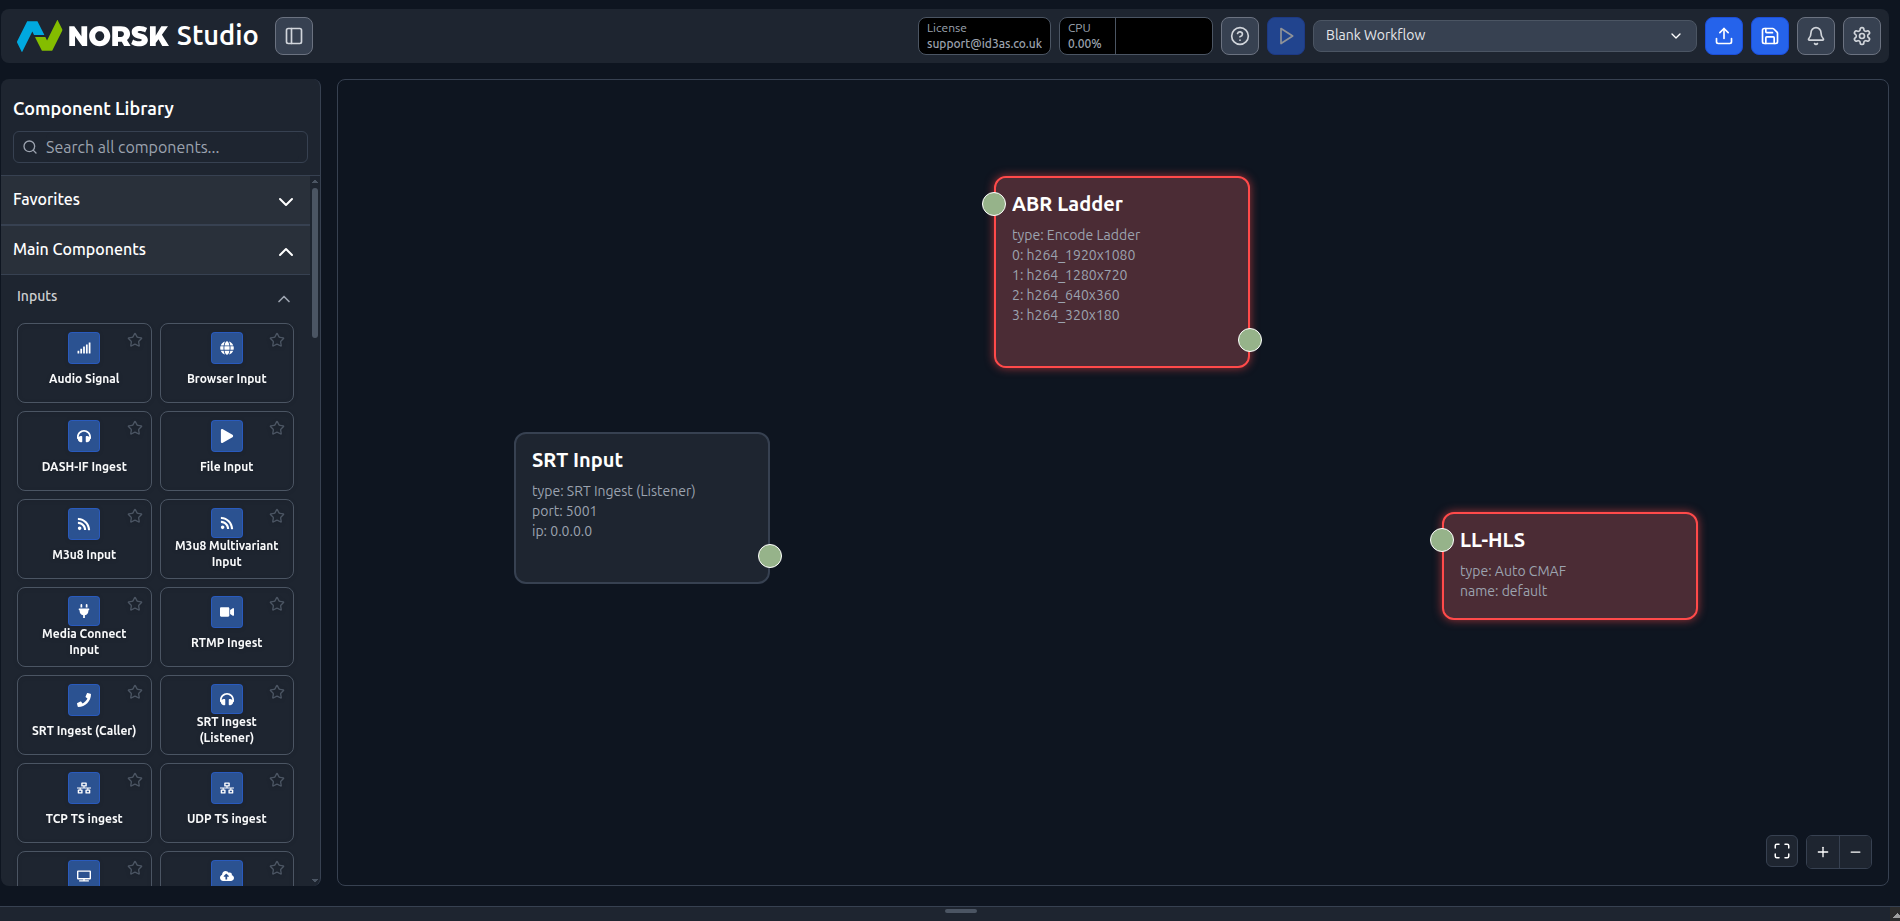
Now add the output. Drag an Auto CMAF component onto the canvas — here it’s given the display name LL-HLS, since it packages the encoded renditions as low-latency HLS/DASH:
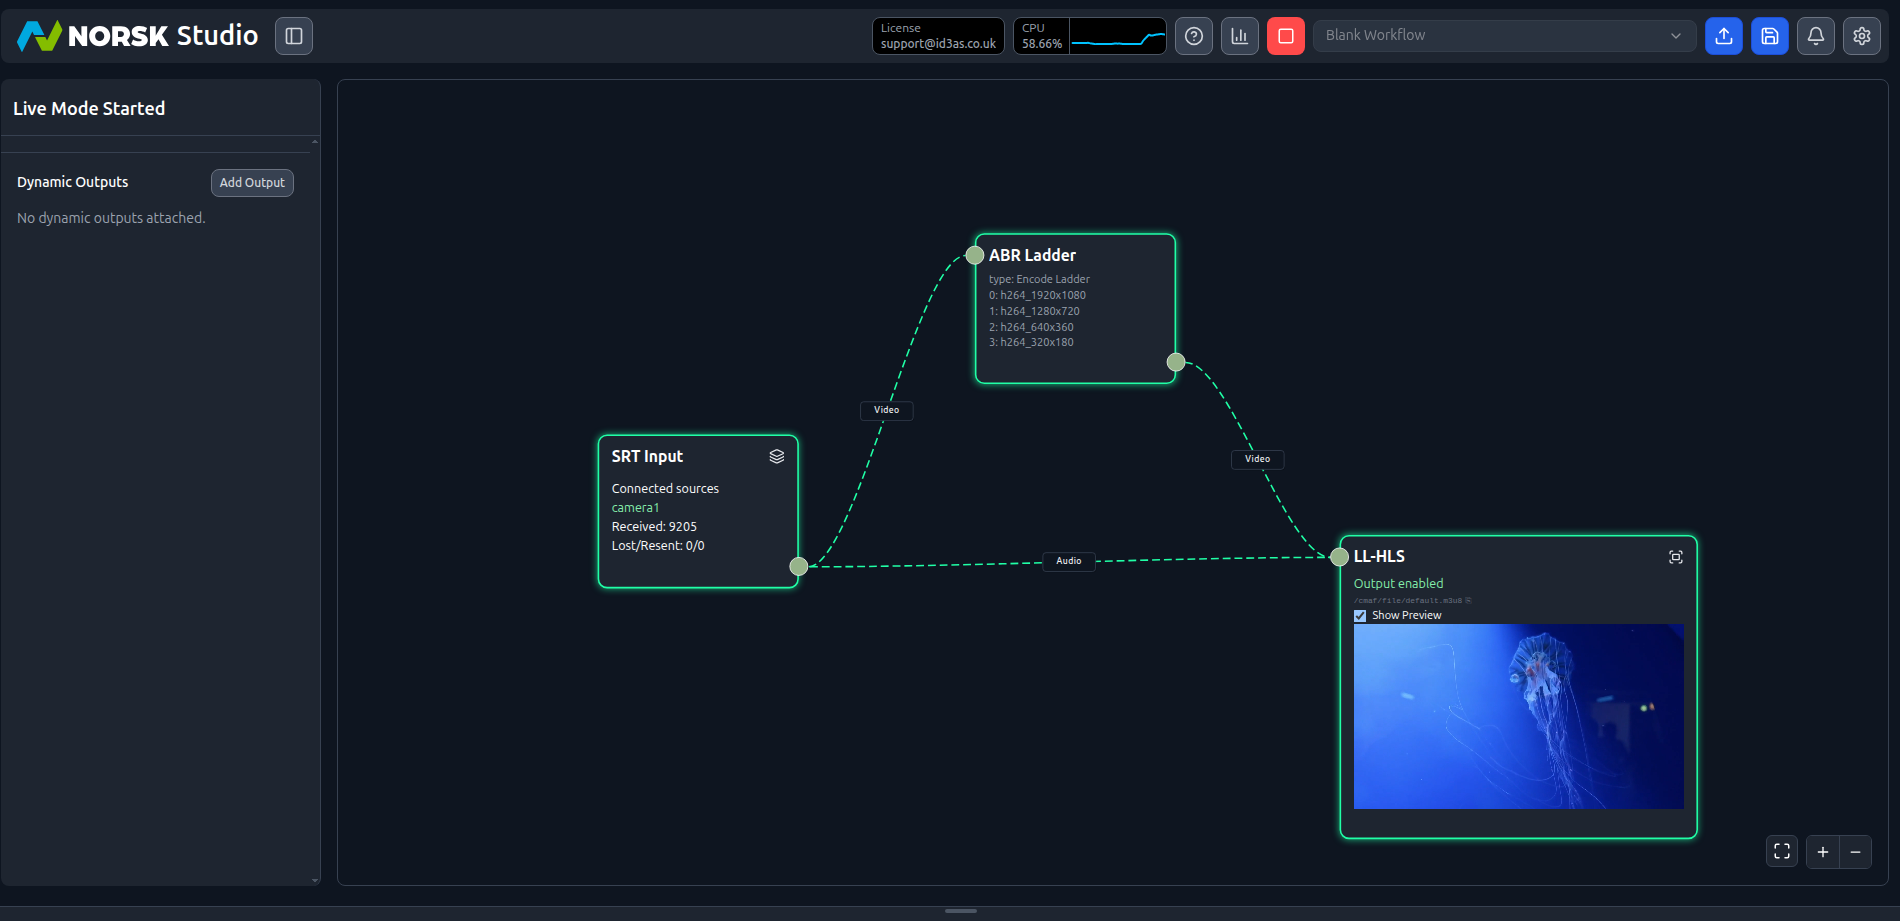
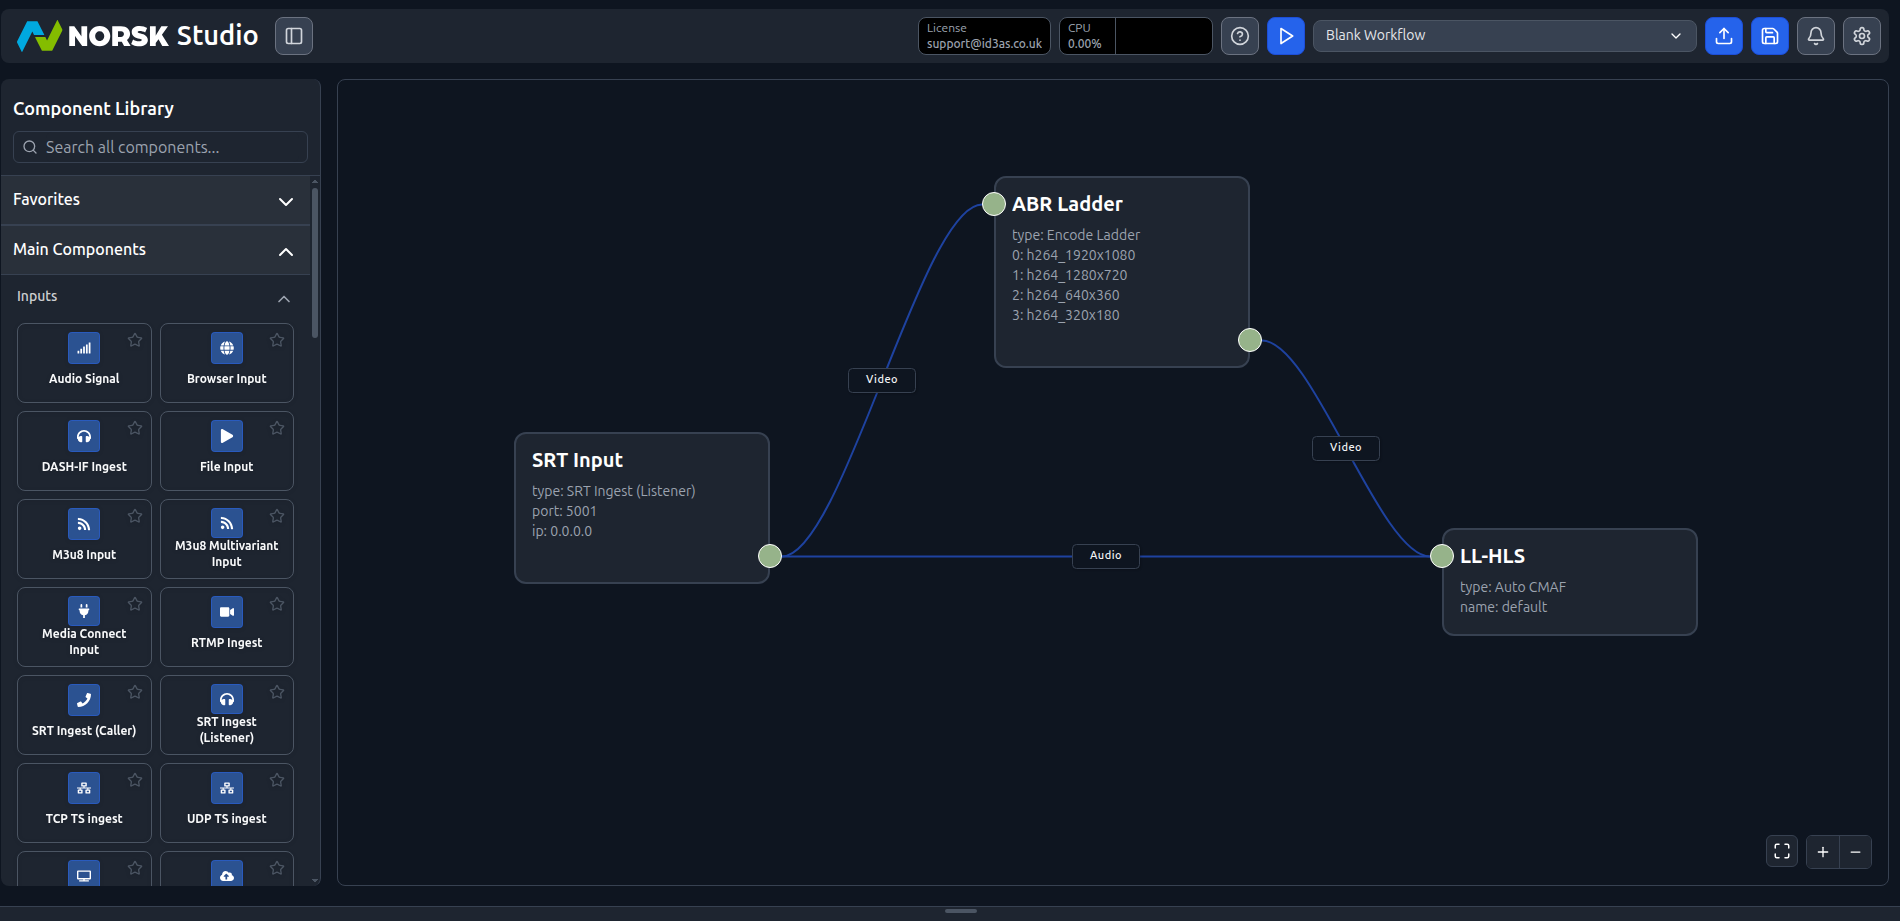
Wire it together: connect the SRT input’s video to the Encode Ladder, the Encode Ladder to the Auto CMAF output, and the SRT input’s audio straight through to the output. Norsk labels each connection so you can see the video and audio paths at a glance:
Sending a source to the listener
If you hit play on the above workflow, you’ll notice that the connector lines turn orange but no data flows through. That’s because we have yet to send a data source to the listening SRT port. To send a test media file as input, you can run:
./sample-srt-source.sh camera1 startThe above script will download two sources from an S3 bucket and stream them to the SRT listener depending on which one you specify, i.e., camera1 or camera2. Your workflow now goes live: the SRT input reports the connected source and packets received, the connections turn green, and you can tick Show Preview on the output component to watch the stream right in the dashboard: